Tissue Motif Links for Annotation and Visualisation
A series of images have been captured using a Hammamatsu slide scanner. From each full image (not shown here) a series of sub-regions have been selected to represent a series of tissue types: gut, pancreas, kidney, lung, heart, ileum, liver and bone. For each image one ort more capillaries have been identified, delineated and the Tissue Motif "guard region" of 40 micron depth defined by a dilation operation on the capillary region. Within each region the individual cells of each type are marked. The capillary, tissue motif region and the cells are all displayed as overlays on the motif images below. The view the image and overlays select from the links below.
Once defined the primary tissue motifs (PTM) have been analysed using semantic similarity in the context of the cell and tissue ontologies. Thes results of this analysis can be displayed in various ways. In this page we provide links to showing the clusters in hiearchical or net-work form to provide examples of possibiities for browsing and querying the data.
The last demo link provides a view of annotation in 3D of a sample of human colon lining with a number of capillaries, associated FTU sominas and marked up cell types.
Tissue Motif Images
Each set of images has a link for the image viewer with capillary and tissue motif domain overlays and a link to the ftp site with the original images.
| Data Set | Links | Comment |
|---|---|---|
07_9489_F_1_gut |
Resolution the same for each image and measured at 6.62 pixels per micron. Capillary regions therefore dilated by 265 pixels to define the TM domain. |
|
07_9489_F_1_pancreas |
Resolution is different for each image. Image 1 has resolution 133 pixels per 40 microns and image 2 has resolution 265 pixels per 40 microns. TM domain set accordingly. |
|
07_9489_F_6_kidney |
Resolution the same for each image and measured at 177 pixels per 40 microns. |
|
07_9577_M_6_kidney |
Resolution the same for each image and measured at 177 pixels per 40 microns. Note the interactive viewer section count is off-set by 5. The section 1 corresponds to image 6, 2 to 7 and so on. |
|
07_9577_M_9_lung |
Resolution the same for each image and measured at 177 pixels per 40 microns. |
|
07_9577_M_8_heart |
Resolution the same for each image and measured at 177 pixels per 40 microns. |
|
07_9489_F_3_ileum |
Resolution the same for each image and measured at 177 pixels per 40 microns. |
|
07_9489_F_6_liver |
Resolution the same for each image and measured at 177 pixels per 40 microns. |
|
07_9489_F_12_bone |
Bone original images seemed to be missing 01 & 02 and there was an additional 8a which I have shifted to 11. Resolution the same for each image and measured at 177 pixels per 40 microns. |
Tissue Motif Clustering
For each pair of tissue motifs a PTM semantic similarityhas been defined by João D Ferreira et al, Lisbon, using the cell, tissue and anatomy ontologies. This similarity can be used to cluster the observed primary tissue motifs (PTM) with the result below calculated and visualised using R. |
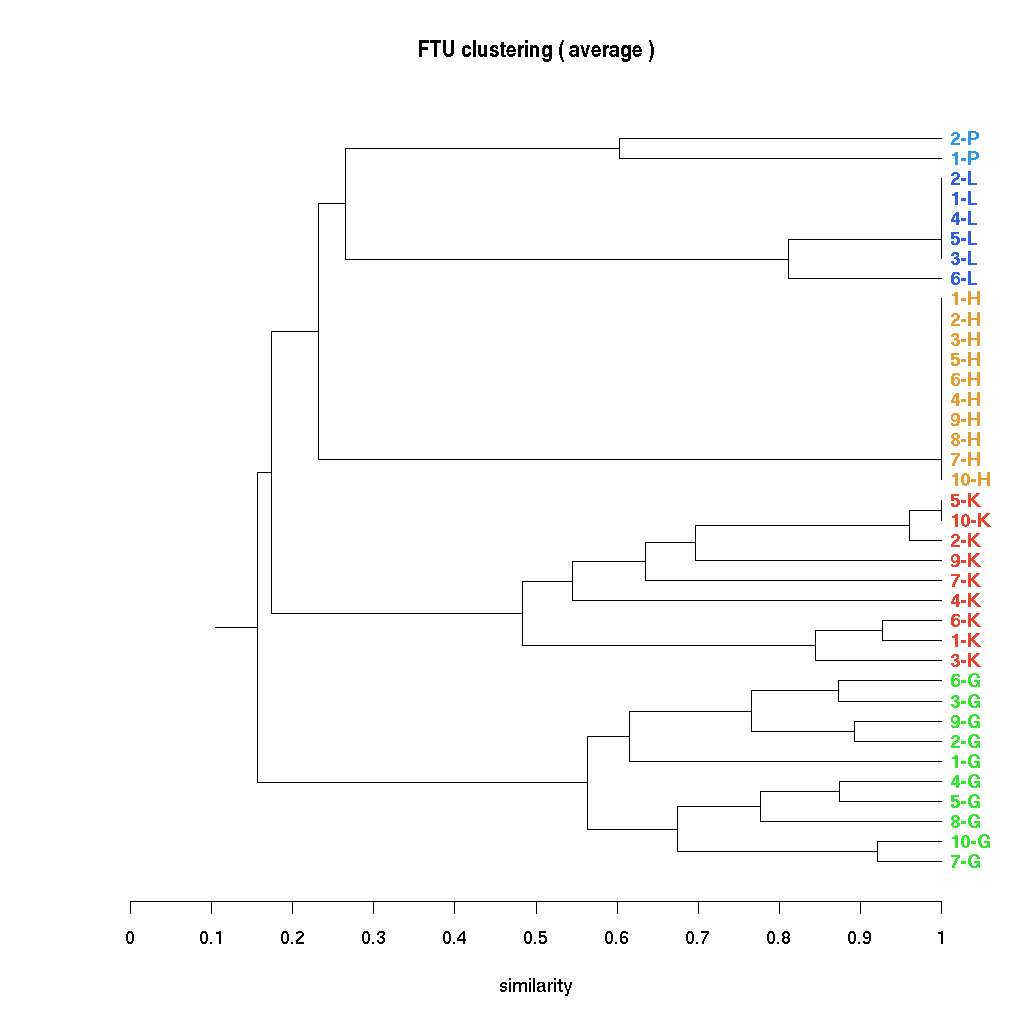 |
|---|
The cluster can also be visualised interactively using the Java TreeView software from Alok Saldanha developed in combination with the Cluster program from Eisen et al. Data for these programmes can be downloaded (PTMClusters.zip) and opened either for re-clustering or display. If the JavaTreeView Configuration file is copied to the home directory then the selected PTM will link to the corresponding marked up image set for that tissue. This sequence is illustrated below with screen shots and a short movie.
| The cluster program can be applied to the file PTM_InteractionMatrix.txt in the downloaded zip to re-cluster the data using different similarity/correlation measures. Note this may overwite the other files generated using Cluster. | 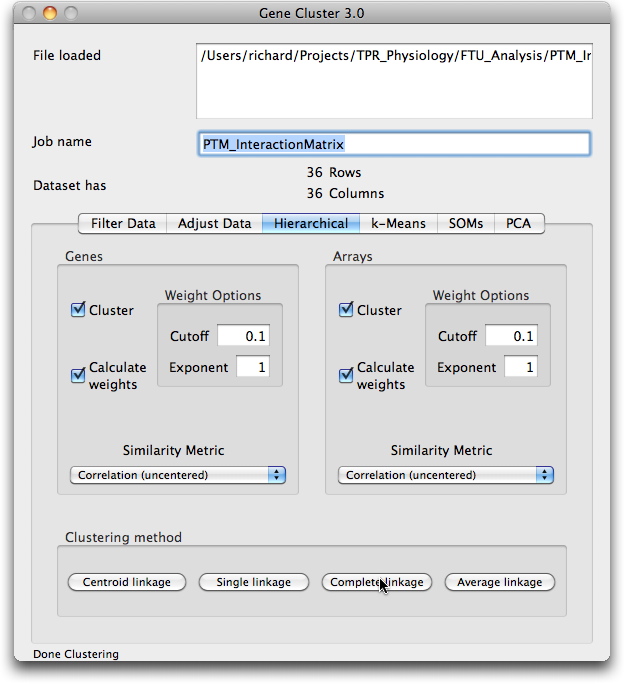 |
|---|---|
| Cluster produces a series of files than can be used to visualise the data using JavaTreeView. Here we have read in the PTMInteractionMatric.cdt file. | 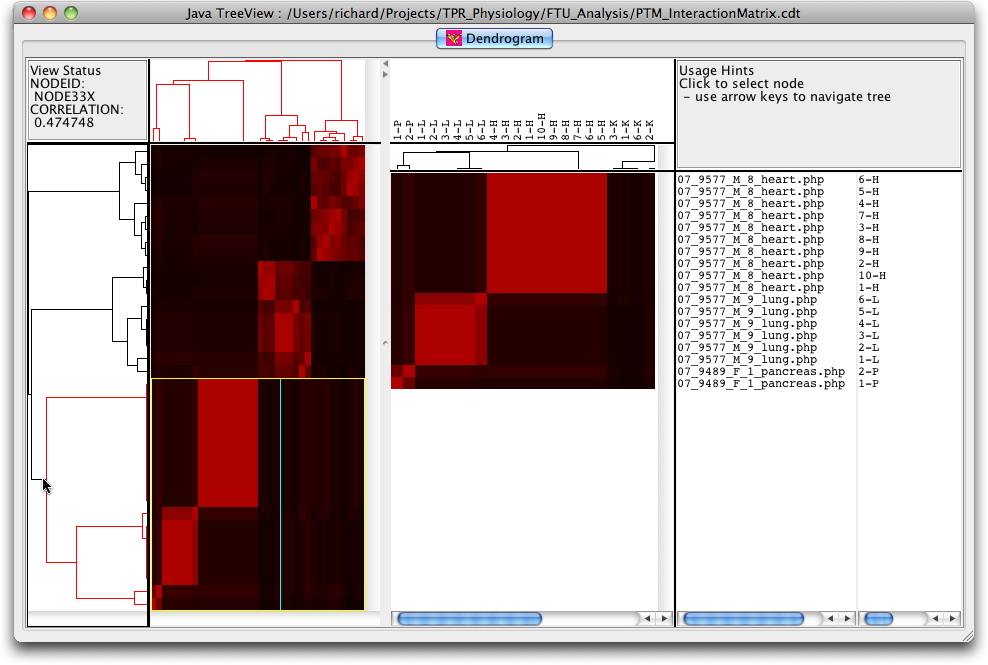 |
| Selection "Settings->URL Settings..." allows the path to the PTM viewer to be set. This is included in the config file but can be added using "Settings->Presets-> Gene URL Presets...". | 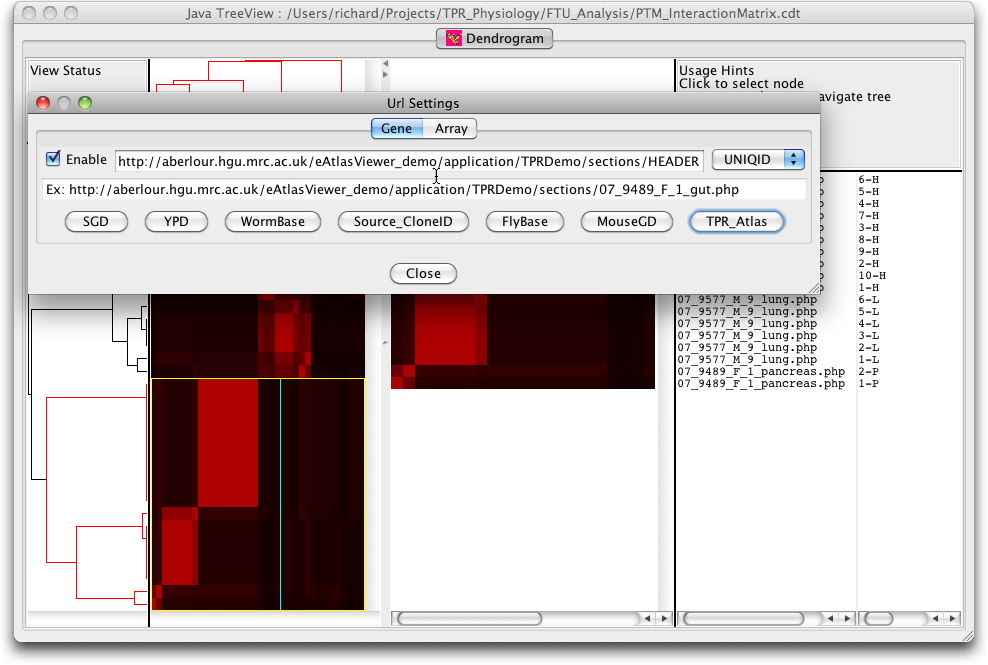 |
| For a given PTM click over the RHS panel to invoke the PTM display - see the location of the cursor. | 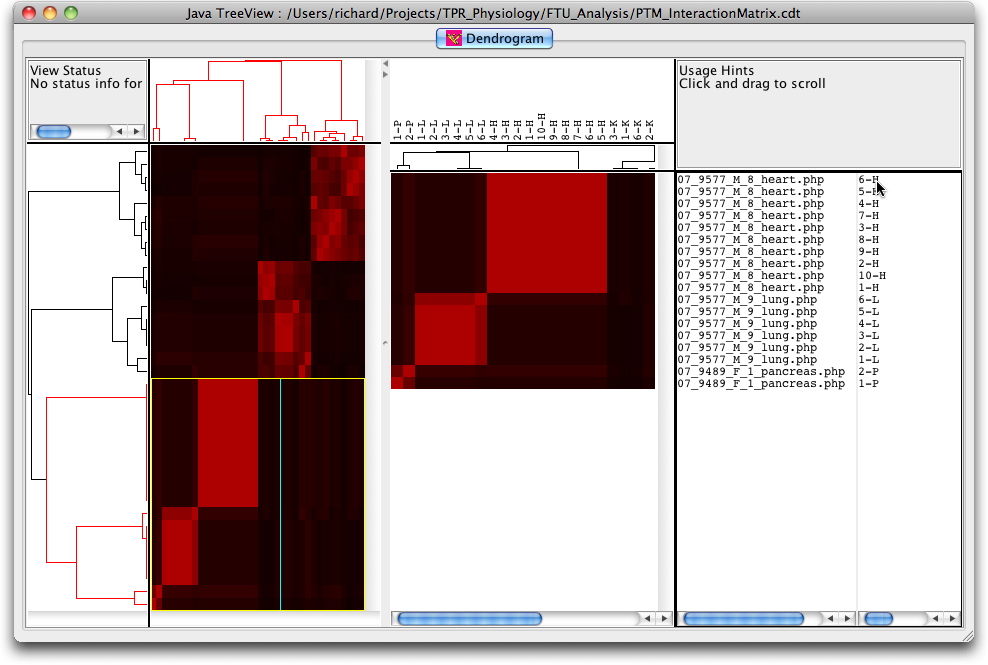 |
| Once the PTM viewer displays then select the required PTM by adjusting the section number. The PTM overlay can be shown by selecting the required overlay in the RHS tree display. | 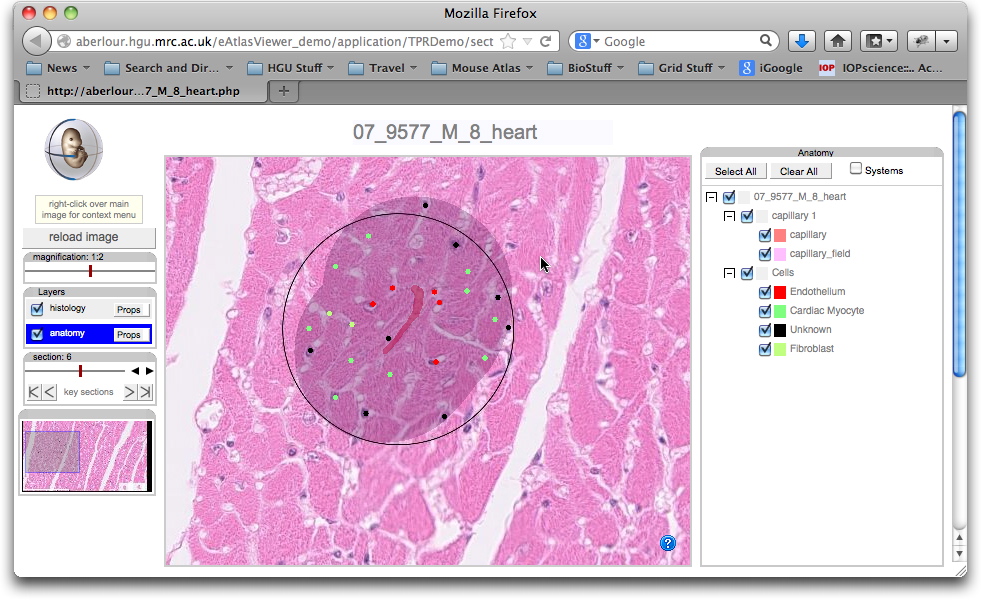 |
| Here is a short movie showing the process of reading in the data file, adjusting a few parameters and displaying the corresponding motif. | |
Force Directed Graph View
The d3 JavaScript visulisation library provides a massive range of possibiities display of numerical data. As an example we show here the series of PTMs as nodes in a network with the node proximity determined by the strength of the PTM similarity. In this case the gut PTMs are sufficiently dissimilar that with thresholding the gut cluster is speparated from the other PTMs. This visualisation allows exploration of the data and an understanding of the segragation of the clusters.
| Click on the image to the right to give a live view of the force-directed graph. Each node is a different PTM coloured by the underlying tissue. | 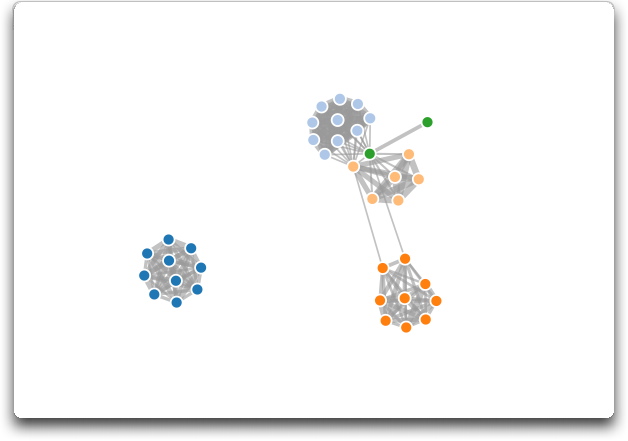 |
|---|
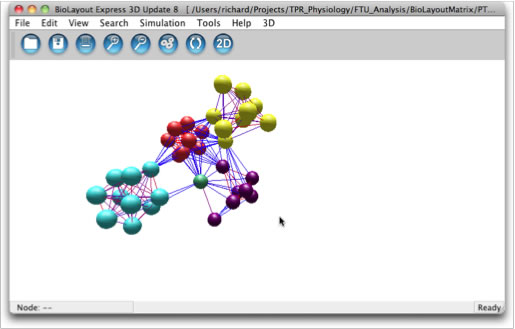
BioLayout3D Graph Visualisation
The BioLayout3D graph visualisation programme from the Roslin Institute is a sophisticated 3D graph viewer for very large scale data. Here we have generate "matrix" data which can be read in for display and browsing. The programme will also perform clustering and with additional information classification analysis. The input data can be downloaded and used to recreate the views below.
3D Reconstruction of Colon with Functional Tissue Unit annotation
| Click on the image to the right to give an interactive view of the 3D reconstruction of the colon sample. The sample was sectioned at 2 micron thickness and imaged with a pixel resolution of about 0.34 microns. The images were re-aligned and comnbined to a single 3D image stack. The viewer provide a pan and zoom interface with controls to allow arbitrary orientation sections through the stack. | 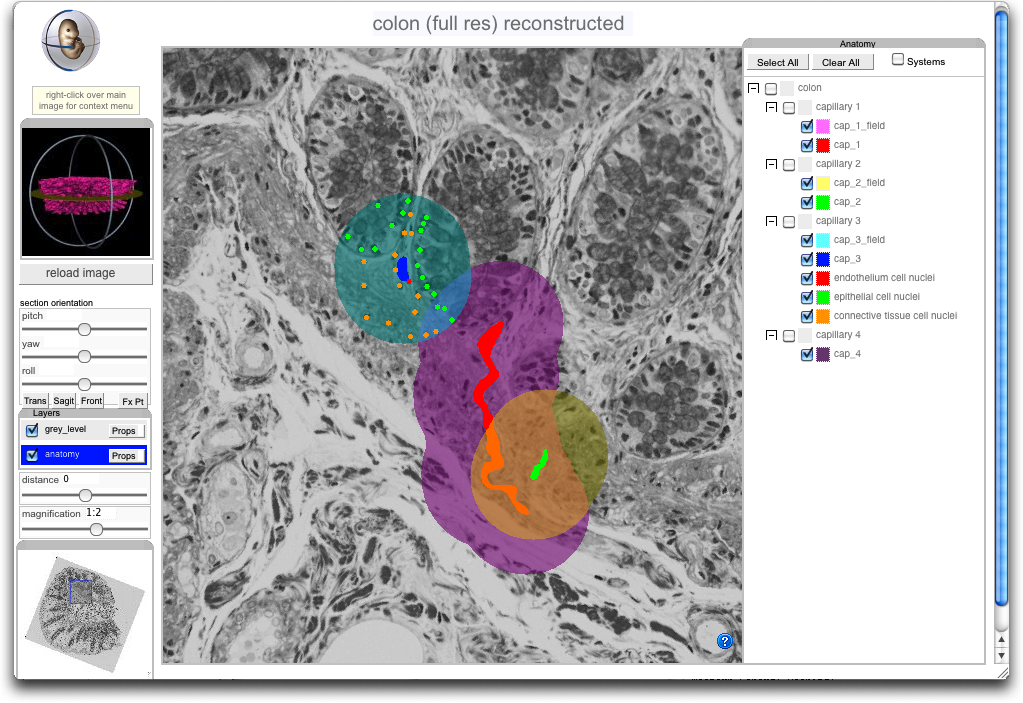 |
|---|